Every month, the Design team produces hundreds of graphics and videos for several clients, which sums up to 10 thousands files per year.
In my role as Design Lead, I wanted to share insights about production with the rest of the management board and increase transparency.
Shareable Project Files
As a first step, I needed all the files produced by the team inside a shared folder structure.
When I joined the team, back in 2019, everyone was still saving their files on their own laptops, so we needed a server as a very first step.
After a first attempt with NAS and its optimization, I learned about Google Stream (now called Google Drive), which let us connect to our Google Drive just as a local folder (at that time Google was still mainly providing their Backup and Sync app).
We could now select which files had to be available offline. The rest (about 20 Terabytes of data) could be downloaded selectively.
Folder Structure
Every designer has their own way of organising files. The design team and I discussed the file structure internally, looking for a solution that could have fit everyone.
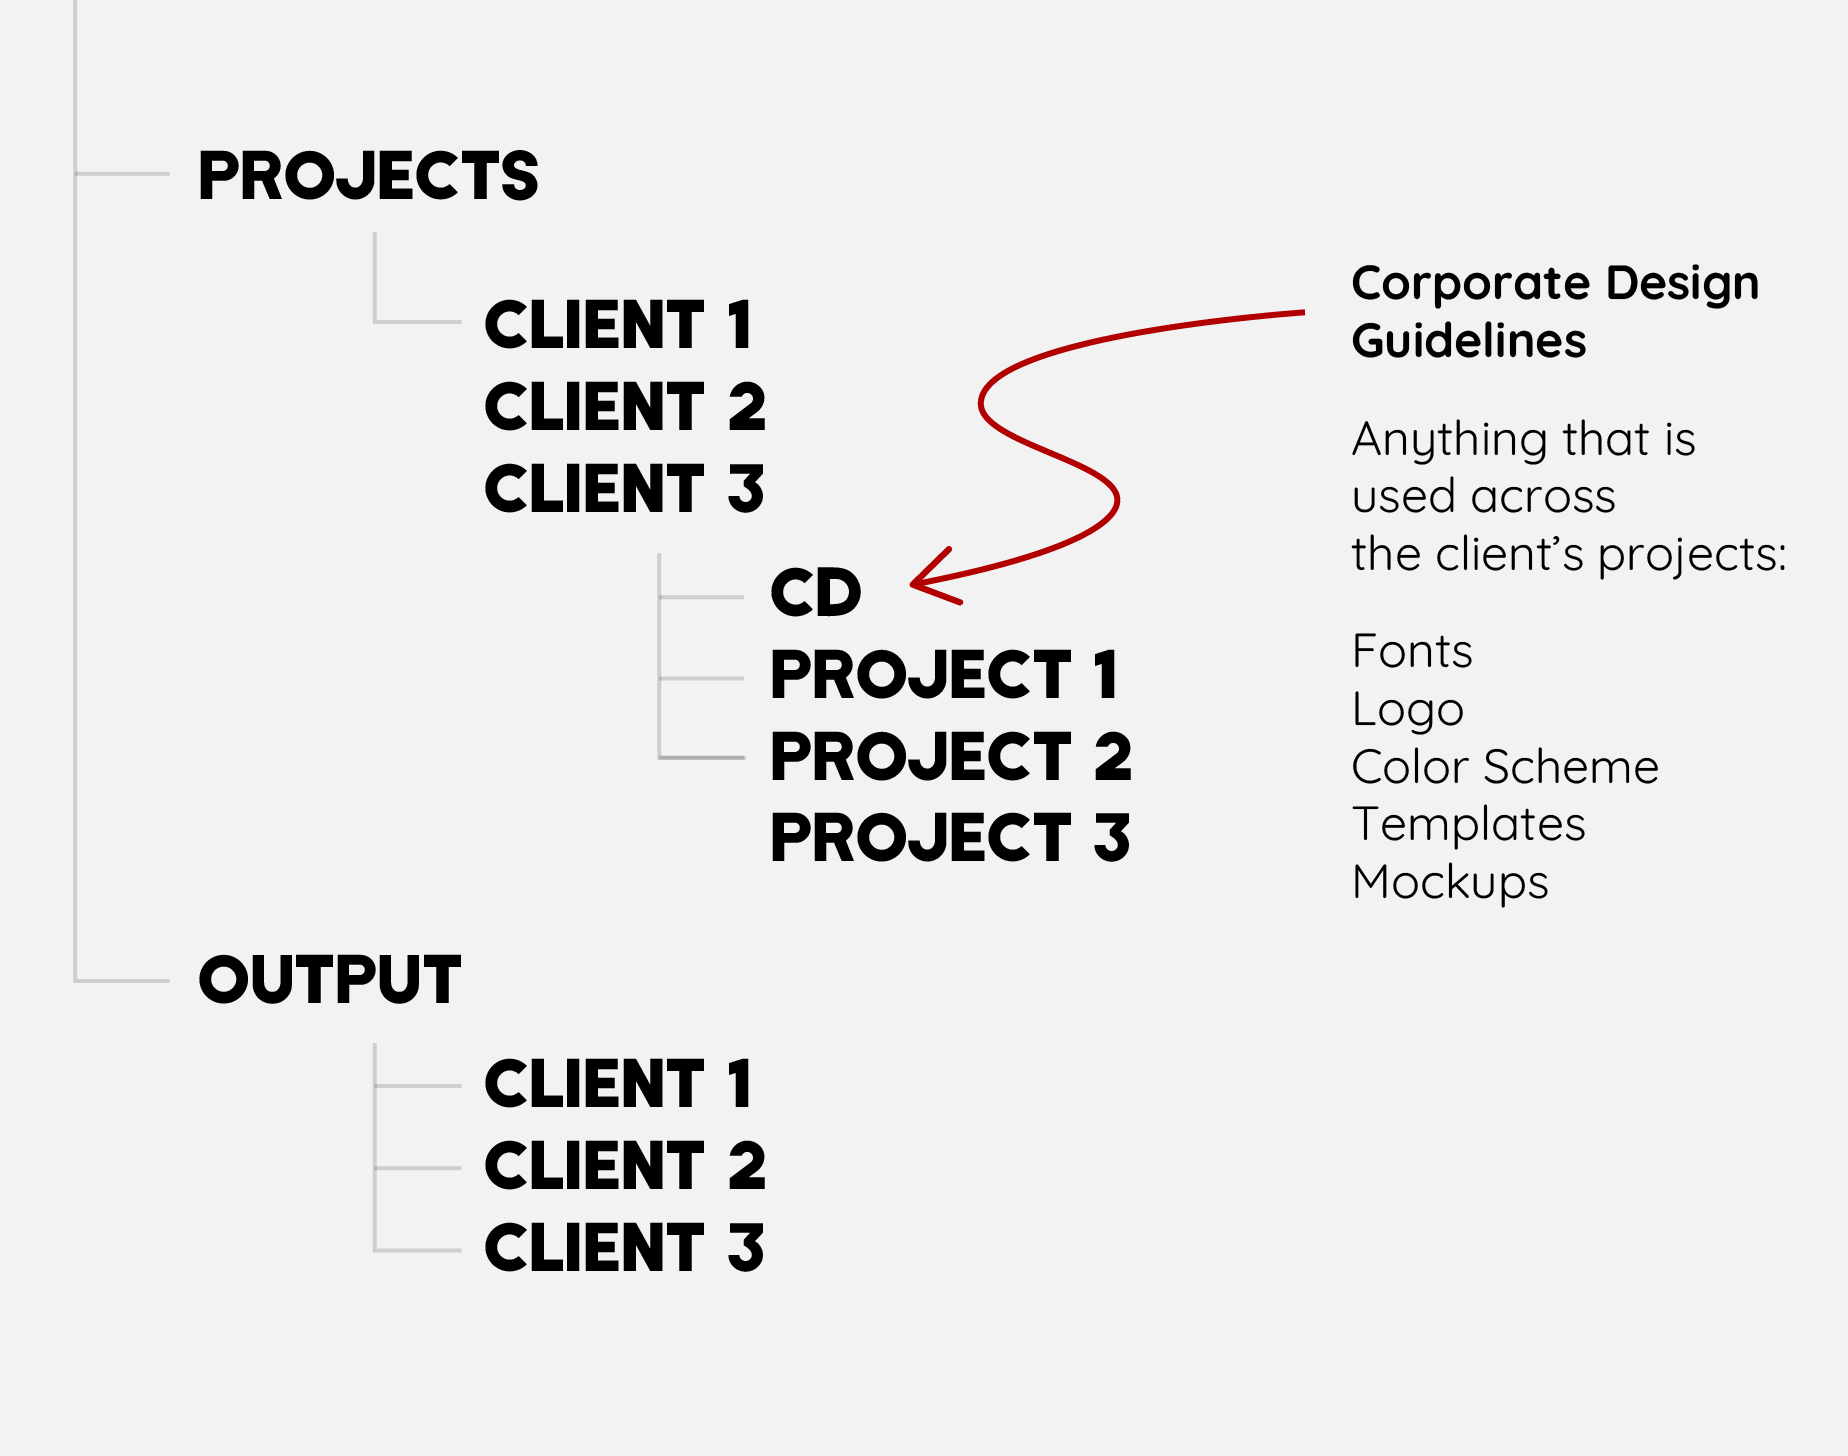
The team learned to store all the original editable files and assets in a Project folder and render they output files in a separate Output folder, which is shared with the other teams.

File Naming
With the Output folder up and running, I had a source from where I could pull data. Though, I was still missing some important information, such as Client name, date of production and typology of file.
Again, I discussed with the team a file-naming protocol which could include these information.
Once we decided for a protocol, from time to time, we had to go thought the onboarding again together, double-check typos and set up reminders to avoid messing up the data. It wasn’t always easy, but once the team could see the results, they found their motivation to follow the protocol.

Database
At last, I could instruct a programmer to write a script that targeted the Output folder and pasted the filenames into a Google spreadsheet database.
Every time the script read the underscore symbol _ in a filename, it writes what follows in the next column of the database. The script also fetches the URL of each file and the duration of each video from their metadata.

Development
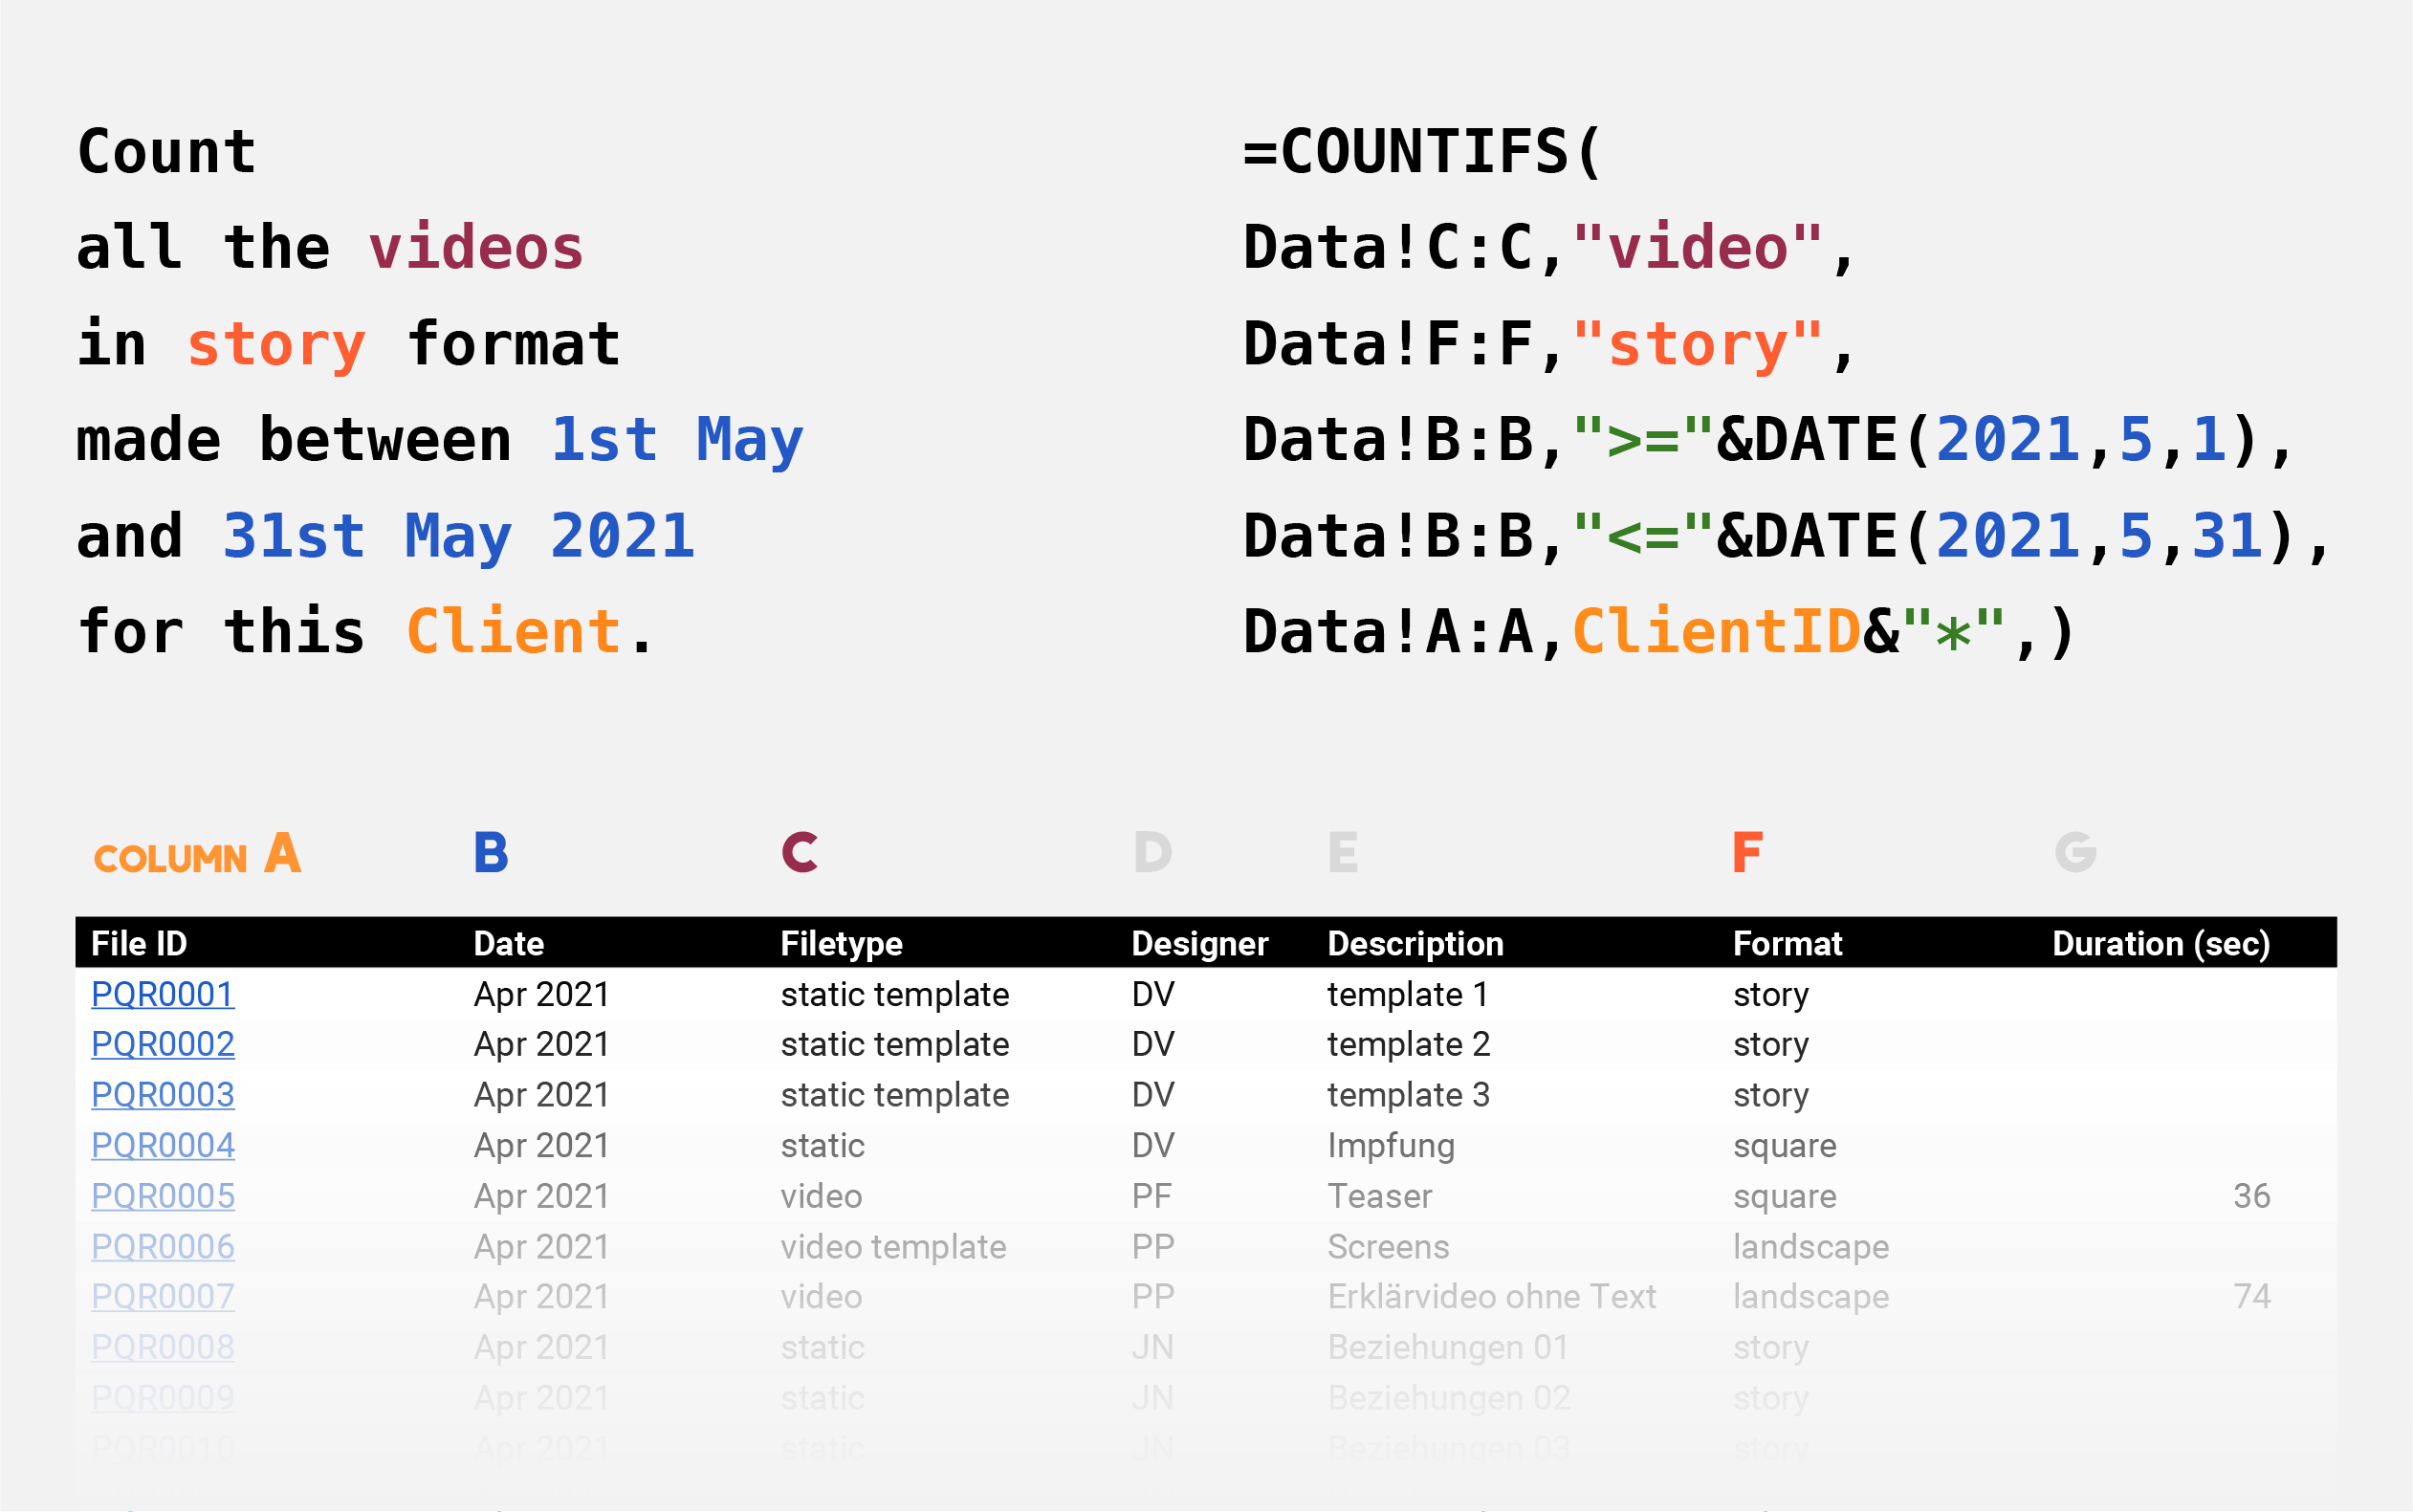
I could generate insights from the database via a series of interconnected formulas.

Dashboard
Now I could finally built a dashboard that could glimpse over the team’s production. The dashboard features a drop-down menu that filters the results per client.
(The data visualised in the charts below are fictional)
Results
The learnings generated by the database supported all departments across the organisation taking informed decisions.
Finance – Proof or update the clients’ invoices with the actual content production.
Accounting – Insights over the clients’ activity. For instance, the dashboard will show if a client decreased their involvement compared to the previous months. It might be time to revamp our collaboration.
Business Intelligence – The performance of the published content can now be linked to the actual visuals. With this infrastructure in place, we can learn what performs better both on a quantitative and qualitative standpoint.
HR – Identify trends per product: learning, for instance, that there is an increasing demand for animated content could lead to hire more motion designers.
Repeat! Repeat!
The database is fully automated, the team only needs to name their files following the protocol.
It took quite some time to onboard everyone properly, listen to their concerns and optimise the tool in a way that inspired them to give their support.
